Adding or Posting Source Code in a WordPress Blog

This took me a little while to get the hang of because my source code didn’t maintain its formatting whenever I uploaded it to my blog. In order to get source code to format correctly, you need to use the “Text” tab in the “Add New Post” menu instead of the “Visual” tab in order for it to preserve tabs and spaces. It seems that, by default, the Visual tab’s behavior causes pastings of source code to remove or delete spaces and tabs. Here is a screenshot of where you should be when paste code in:

Where you should be pasting.
Where you want to be when you paste code in a WordPress blog.

Once you’ve pasted it with correct formatting, just wrap your code in [code language=”X”] and [/code] tags, where the value of X is any one of the following values (representative of the language your code is written in and thus, the language you want your code to be parsed as):

  • actionscript3
  • bash
  • clojure
  • coldfusion
  • cpp
  • csharp
  • css
  • delphi
  • erlang
  • fsharp
  • diff
  • groovy
  • html
  • javascript
  • java
  • javafx
  • matlab (keywords only)
  • objc
  • perl
  • php
  • text
  • powershell
  • python
  • r
  • ruby
  • scala
  • sql
  • vb
  • xml

Load Testing CPU Cores in C#

I wrote a small Console application in C# that will nuke your logical processors (by nuke, I mean to say that it will eat your CPU utilization, and you’ll see each core spool up to 100% usage):

using System;
using System.Runtime.InteropServices;
using System.Threading;

namespace CPUHog
{
    class Program
    {

        [DllImport("kernel32.dll")]
        static extern IntPtr GetCurrentThread();
        [DllImport("kernel32.dll")]
        static extern IntPtr SetThreadAffinityMask(IntPtr hThread, IntPtr dwThreadAffinityMask);

        static void Main(string[] args)
        {
            Console.WriteLine("Starting the CPU hog.");
            Console.WriteLine("Number of logical processors: {0}", Environment.ProcessorCount);
            for (int i = 0; i < Environment.ProcessorCount; i++)
            {
                SpoolThread(i);
            }
            Console.WriteLine("Press any key to exit the CPU hog.");
            Console.ReadLine();
            Environment.Exit(0);
        }

        // Spools a spinning thread on a given CPU core.
        static void SpoolThread(int core)
        {
            new Thread(() =>
            {
                Thread.BeginThreadAffinity();
                Console.WriteLine("Nuking logical processor {0}.", core);
                SetThreadAffinityMask(GetCurrentThread(), new IntPtr(1 << (int)(core)));
                // The while loop below is what actually does the nuking.
                while (true) { }
            }).Start();
        }
    }
}

To view its effects, use Task Manager (CTRL + SHIFT + ESCAPE) -> Performance tab -> Click on CPU -> Right click the graph on the right-hand side (in the CPU view) -> Change graph to -> Logical processors. You’ll see something like this:

See the CPUHog in action
Showcasing the CPUHog in action.

Decoding VOX Files in C# (Converting VOX Files to WAV Files)

I wrote a C# class to decode VOX files into WAV files. It follows the Dialogic ADPCM specification strictly. If you read through that specification, the code below will become a lot clearer, otherwise you might think you’re reading another language altogether. The specification is really quite simple and nice once you boil it down. Note that the Dialogic ADPCM specification is different from the way NMS Communications libraries create VOX files as their file format is slightly different, and for files such as those, the code below will not work without some tweaks.

My implementation to decode from VOX to WAV files is as follows:

using System;
using System.IO;

class VOXDecoder
{

    static float signal = 0;
    static int previousStepSizeIndex = 0;
    static bool computedNextStepSizeOnce = false;
    static int[] possibleStepSizes = new int[49] { 16, 17, 19, 21, 23, 25, 28, 31, 34, 37, 41, 45, 50, 55, 60, 66, 73, 80, 88, 97, 107, 118, 130, 143, 157, 173, 190, 209, 230, 253, 279, 307, 337, 371, 408, 449, 494, 544, 598, 658, 724, 796, 876, 963, 1060, 1166, 1282, 1411, 1552 };

    public static void Decode(string inputFile, out string outputFile)
    {
        outputFile = String.Format("{0}\\{1}.wav", Path.GetDirectoryName(inputFile), Path.GetFileNameWithoutExtension(inputFile));
        using (FileStream inputStream = File.Open(inputFile, FileMode.Open))
        using (BinaryReader reader = new BinaryReader(inputStream))
        using (FileStream outputStream = File.Create(outputFile))
        using (BinaryWriter writer = new BinaryWriter(outputStream))
        {
            // Note that 32-bit integer values always take up 4 bytes.
            // Note that 16-bit integer values (shorts) always take up 2 bytes.
            // Note that HEX values resolve as 32-bit integers unless casted as something else, such as short values.
            // ChunkID: "RIFF"
            writer.Write(0x46464952);
            // ChunkSize: The size of the entire file in bytes minus 8 bytes for the two fields not included in this count: ChunkID and ChunkSize.
            writer.Write((int)(reader.BaseStream.Length * 4) + 36);
            // Format: "WAVE"
            writer.Write(0x45564157);
            // Subchunk1ID: "fmt " (with the space).
            writer.Write(0x20746D66);
            // Subchunk1Size: 16 for PCM.
            writer.Write(16);
            // AudioFormat: 1 for PCM.
            writer.Write((short)1);
            // NumChannels: 1 for Mono. 2 for Stereo.
            writer.Write((short)1);
            // SampleRate: 8000 is usually the default for VOX.
            writer.Write(8000);
            // ByteRate: SampleRate * NumChannels * BitsPerSample / 8.
            writer.Write(12000);
            // BlockAlign: NumChannels * BitsPerSample / 8. I rounded this up to 2. It sounds best this way.
            writer.Write((short)2);
            // BitsPerSample: I will set this as 12 (12 bits per raw output sample as per the VOX specification).
            writer.Write((short)12);
            // Subchunk2ID: "data"
            writer.Write(0x61746164);
            // Subchunk2Size: NumSamples * NumChannels * BitsPerSample / 8. You can also think of this as the size of the read of the subchunk following this number.
            writer.Write((int)(reader.BaseStream.Length * 4));
            // Write the data stream to the file in linear audio.
            while (reader.BaseStream.Position != reader.BaseStream.Length)
            {
                byte b = reader.ReadByte();
                float firstDifference = GetDifference((byte)(b / 16));
                signal += firstDifference;
                writer.Write(TruncateSignalIfNeeded());
                float secondDifference = GetDifference((byte)(b % 16));
                signal += secondDifference;
                writer.Write(TruncateSignalIfNeeded());
            }
        }
    }

    static short TruncateSignalIfNeeded()
    {
        // Keep signal truncated to 12 bits since, as per the VOX spec, each 4 bit input has 12 output bits.
        // Note that 12 bits is 0b111111111111. That's 0xFFF in HEX. That's also 4095 in decimal.
        // The sound wave is a signed signal, so factoring in 1 unused bit for the sign, that's 4095/2 rounded down to 2047.
        if (signal > 2047)
        {
            signal = 2047;
        }
        if (signal < -2047)
        {
            signal = -2047;
        }
        return (short)signal;
    }

    static float GetDifference(byte nibble)
    {
        int stepSize = GetNextStepSize(nibble);
        float difference = ((stepSize * GetBit(nibble, 2)) + ((stepSize / 2) * GetBit(nibble, 1)) + (stepSize / 4 * GetBit(nibble, 0)) + (stepSize / 8));
        if (GetBit(nibble, 3) == 1)
        {
            difference = -difference;
        }
        return difference;
    }

    static byte GetBit(byte b, int zeroBasedBitNumber)
    {
        // Shift the bits to the right by the number of the bit you want to get and then logic AND it with 1 to clear bits trailing to the left of your desired bit. 
        return (byte)((b >> zeroBasedBitNumber) & 1);
    }

    static int GetNextStepSize(byte nibble)
    {
        if (!computedNextStepSizeOnce)
        {
            computedNextStepSizeOnce = true;
            return possibleStepSizes[0];
        }
        else
        {
            int magnitude = GetMagnitude(nibble);
            if (previousStepSizeIndex + magnitude > 48)
            {
                previousStepSizeIndex = previousStepSizeIndex + magnitude;
                return possibleStepSizes[48];
            }
            else if (previousStepSizeIndex + magnitude > 0)
            {
                previousStepSizeIndex = previousStepSizeIndex + magnitude;
                return possibleStepSizes[previousStepSizeIndex];
            }
            else
            {
                return possibleStepSizes[0];
            }
        }
    }

    static int GetMagnitude(byte nibble)
    {
        if (nibble == 15 || nibble == 7)
            return 8;
        else if (nibble == 14 || nibble == 6)
            return 6;
        else if (nibble == 13 || nibble == 5)
            return 4;
        else if (nibble == 12 || nibble == 4)
            return 2;
        else
            return -1;
    }
}

It is easily called through the following two lines:

string outputWAVFilePath;
VOXDecoder.Decode(pathToYourVOXFile, out outputWAVFilePath);

Give it a shot with this sample Dialogic ADPCM VOX audio file.

P/Invoke NotifyServiceStatusChange from C#

This article actually touches up on some advanced topics of C#, and some things that you may not have ever come across. MSDN has this to say about threads:

An operating-system ThreadId has no fixed relationship to a managed thread, because an unmanaged host can control the relationship between managed and unmanaged threads. Specifically, a sophisticated host can use the CLR Hosting API to schedule many managed threads against the same operating system thread, or to move a managed thread between different operating system threads.

What this is really trying to explain is thread affinity, and that you are not guaranteed to have a native thread map 1-to-1 to a managed thread depending on the CLR (Common Language Runtime) that is hosting your code. This is important to know when you P/Invoke into native functions that require calling back into your C# code after a period of time (such as NotifyServiceStatusChange). We want to maintain that 1-to-1 relationship using Thread.BeginThreadAffinity() because the marshaling layer needs to have a valid callback reference at all times.

Here is the code that you can use to P/Invoke NotifyServiceStatusChange in C# in order to wait for a service to stop:

using System;
using System.Runtime.InteropServices;
using System.Threading;

class ServiceAssistant
{
    [System.Runtime.InteropServices.StructLayoutAttribute(System.Runtime.InteropServices.LayoutKind.Sequential)]
    public class SERVICE_NOTIFY
    {
        public uint dwVersion;
        public IntPtr pfnNotifyCallback;
        public IntPtr pContext;
        public uint dwNotificationStatus;
        public SERVICE_STATUS_PROCESS ServiceStatus;
        public uint dwNotificationTriggered;
        public IntPtr pszServiceNames;
    };

    [System.Runtime.InteropServices.StructLayoutAttribute(System.Runtime.InteropServices.LayoutKind.Sequential)]
    public struct SERVICE_STATUS_PROCESS
    {
        public uint dwServiceType;
        public uint dwCurrentState;
        public uint dwControlsAccepted;
        public uint dwWin32ExitCode;
        public uint dwServiceSpecificExitCode;
        public uint dwCheckPoint;
        public uint dwWaitHint;
        public uint dwProcessId;
        public uint dwServiceFlags;
    };

    [DllImport("advapi32.dll")]
    static extern IntPtr OpenService(IntPtr hSCManager, string lpServiceName, uint dwDesiredAccess);

    [DllImport("advapi32.dll")]
    static extern IntPtr OpenSCManager(string machineName, string databaseName, uint dwAccess);

    [DllImport("advapi32.dll")]
    static extern uint NotifyServiceStatusChange(IntPtr hService, uint dwNotifyMask, IntPtr pNotifyBuffer);

    [DllImport("kernel32.dll")]
    static extern uint SleepEx(uint dwMilliseconds, bool bAlertable);

    [DllImport("advapi32.dll")]
    static extern bool CloseServiceHandle(IntPtr hSCObject);

    delegate void StatusChangedCallbackDelegate(IntPtr parameter);

    /// <summary> 
    /// Block until a service stops, is killed, or is found to be already dead.
    /// </summary> 
    /// <param name="serviceName">The name of the service you would like to wait for.</param>
    /// <param name="timeout">An amount of time you would like to wait for. uint.MaxValue is the default, and it will force this thread to wait indefinitely.</param>
    public static void WaitForServiceToStop(string serviceName, uint timeout = uint.MaxValue)
    {
        // Ensure that this thread's identity is mapped, 1-to-1, with a native OS thread.
        Thread.BeginThreadAffinity();
        GCHandle notifyHandle = default(GCHandle);
        StatusChangedCallbackDelegate changeDelegate = ReceivedStatusChangedEvent;
        IntPtr hSCM = IntPtr.Zero;
        IntPtr hService = IntPtr.Zero;
        try
        {
            hSCM = OpenSCManager(null, null, (uint)0xF003F);
            if (hSCM != IntPtr.Zero)
            {
                hService = OpenService(hSCM, serviceName, (uint)0xF003F);
                if (hService != IntPtr.Zero)
                {
                    SERVICE_NOTIFY notify = new SERVICE_NOTIFY();
                    notify.dwVersion = 2;
                    notify.pfnNotifyCallback = Marshal.GetFunctionPointerForDelegate(changeDelegate);
                    notify.ServiceStatus = new SERVICE_STATUS_PROCESS();
                    notifyHandle = GCHandle.Alloc(notify, GCHandleType.Pinned);
                    IntPtr pinnedNotifyStructure = notifyHandle.AddrOfPinnedObject();
                    NotifyServiceStatusChange(hService, (uint)0x00000001, pinnedNotifyStructure);
                    SleepEx(timeout, true);
                }
            }
        }
        finally
        {
            // Clean up at the end of our operation, or if this thread is aborted.
            if (hService != IntPtr.Zero)
            {
                CloseServiceHandle(hService);
            }
            if (hSCM != IntPtr.Zero)
            {
                CloseServiceHandle(hSCM);
            }
            // Keep our callback method around until it is called (until this line of code).
            GC.KeepAlive(changeDelegate);
            if (notifyHandle != default(GCHandle))
            {
                notifyHandle.Free();
            }
            Thread.EndThreadAffinity();
        }
    }

    static void ReceivedStatusChangedEvent(IntPtr parameter)
    {
        // Do nothing.
    }
}

Its so simple, that it can just be called as follows:

ServiceAssistant.WaitForServiceToStop("YourWindowsServiceName");

Note that this is significantly different from the WaitForStatus method that is available to you out of the box in C#, because the WaitForStatus method polls every 250ms between status checks according to the remarks, whereas NotifyServiceStatusChange is event-driven and subscribes to that particular event (so its less overhead in terms of CPU usage).

Understanding the Towers of Hanoi Recursion

I’ve always found this algorithm interesting, ever since I saw it in action back in university. I think it was among the first recursive functions we ever went over, albeit not a simple one to grasp, which is probably the reason why they wanted to teach it to us. Typically, the algorithm to move disks for the Towers of Hanoi is as follows:

public void Calculate(int n, int fromPole, int toPole, int intermediaryPole)
{
	if (n == 1)
	{
		Move(fromPole, toPole); // This is the only place that does the actual move.
	}
	else
	{
		Calculate(n - 1, fromPole, intermediaryPole, toPole); // The first Calculate call in the recursion serves to expose the bottom-most disk.
		Calculate(1, fromPole, toPole, intermediaryPole); // The second call in the Calculate method serves to move the bottom-most disk to the desired pole.
		Calculate(n - 1, intermediaryPole, toPole, fromPole); // The last Calculate call in the recursion does exactly the same thing as the last two calls in this recursion did, except it repeats this process for the disks remaining in the intermediary pole.
	}
}

Assume you call it as follows:

Calculate(numberOfDisksOnTheFirstPole, 0, 2, 1);

The initial conditions are that you have all of the disks on the first pole. You have three poles, and you want to move all disks from pole 0 to 2 via pole 1 as an intermediary pole. Assume 4 disks in total, so that the tower looks like this (each column represents a pole, and the disks are numbered):

1--
2--
3--
4--

Calls then runs as follows (I like to show the flow of the the method through coalescing, recursive function calls because its visually much more understandable to me to project a recursive method this way, and this is a tool I use to trace through recursive methods in order to figure out how they work, and I suggest that you use the same tool to project recursive functions in order to analyze them for understandability for yourself):

Calculate(4, 0, 2, 1)
{
	Calculate(3, 0, 1, 2)
	{
		Calculate(2, 0, 2, 1)
		{
			Calculate(1, 0, 1, 2)
			{
				Moves the disk from pole 0 to pole 1.
				2--
				3--
				41-
			}
			Calculate(1, 0, 2, 1)
			{
				Moves the disk from pole 0 to pole 2.
				3--
				412
			}
			Calculate(1, 1, 2, 0)
			{
				Moves the disk from pole 1 to pole 2.
				3-1
				4-2
			}
		}
		Calculate(1, 0, 1, 2)
		{
			Moves the disk from pole 0 to pole 1.
			--1
			432
		}
		Calculate(2, 2, 1, 0)
		{
			Calculate(1, 2, 0, 1)
			{
				Moves the disk from pole 2 to pole 0.
				1--
				432
			}
			Calculate(1, 2, 1, 0)
			{
				Moves the disk from pole 2 to pole 1.
				12-
				43-
			}
			Calculate(1, 0, 1, 2)
			{
				Moves the disk from pole 0 to pole 1.
				-1-
				-2-
				43-
			}
		}
	} // The last set of calls up to here expose the bottom-most disk, meaning the first Calculate call in the recursion serves to expose the bottom-most disk.
	Calculate(1, 0, 2, 1)
	{
		Moves the disk from pole 0 to pole 2.
		-1-
		-2-
		-34
	} // The second call in the Calculate method serves to move the bottom-most disk to the desired pole.
	Calculate(3, 1, 2, 0)
	{
		Calculate(2, 1, 0, 2)
		{
			Calculate(1, 1, 2, 0)
			{
				Moves the disk from pole 1 to pole 2.
				-21
				-34
			}
			Calculate(1, 1, 0, 2)
			{
				Moves the disk from pole 1 to pole 0.
				--1
				234
			}
			Calculate(1, 2, 0, 1)
			{
				Moves the disk from pole 2 to pole 0.
				1--
				234
			}
		}
		Calculate(1, 1, 2, 0)
		{
			Moves the disk from pole 1 to pole 2.
			1-3
			2-4
		}
		Calculate(2, 0, 2, 1)
		{
			Calculate(1, 0, 1, 2)
			{
				Moves the disk from pole 0 to pole 1.
				--3
				214
			}
			Calculate(1, 0, 2, 1)
			{
				Moves the disk from pole 0 to pole 2.
				--2
				--3
				-14
			}
			Calculate(1, 1, 2, 0)
			{
				Moves the disk from pole 1 to pole 2.
				--1
				--2
				--3
				--4
			}
		}
	} // The last Calculate call in the recursion does exactly the same thing as the last two calls in this recursion did, except it repeats this process for the disks remaining in the intermediary pole.
}

How to Save Money on Gas at the Pump

So, if you’re like me, you love saving a little bit of cash. Am I right? There’s nothing wrong with saving a few pennies in order to purpose them towards better expenses. Let me share a little hack with you that seems to work quite well at the pumps.

Most pumps have a flow measurement system that translates the amount you pump into the amount you pay. Meaning, the harder you clutch that pump, the harder your pockets will hurt at the end of the day. Don’t let your wallet down, play a little game with the pump.

The game’s called “use your senses.” Your ears are a magical weapon. Use them to hear the flow of volume when you’re clutching the pump at maximum grip, and slowly lessen your grip while maintaining the same flow. Its honestly that simple, and you’ll reach an optimum between flow and grip pressure, where you pay as little as possible for the amount of fuel you pump out. These flow measurement systems are often not calibrated as often or as well as you might think, and gripping it at maximum means you’re paying the premium off the bat. Sometimes, a single pump at a specific gas station will be the weakest link. It can be both a fun and rewarding experience in finding it. Plus, it makes pumping a fun challenge. Why not enjoy playing a game while you’re at it? Also, consider that when you do pump fuel, pumping at maximum grip means pumping at maximum pressure. That may or may not be a good thing. Do you really think that at maximum pressure you’re getting only pure fuel out of the underground tank at your local gas station that’s been just sitting there for years? Have you ever tried reusing the same coffee mug to make a batch of coffee? It stains…there’s a deposit that takes place at the bottom of it. Its just unavoidable. What do you think happens to underground fuel tanks?

C#-Style Stack Tracing in MSVC++ Applications with Filenames and Line Numbers

A Little Background

So, you want to trace the stack of C++ applications in Windows, you say? You’ve come to the right place…luckily for you the dbghelp library is what you’re probably after, and I’ll explain that API shortly (I’ve made a very minimalistic class for this exact purpose because it’s just a fantastic library to use in and of itself when debugging, especially if you have some sort of logging mechanisms in place in your code, be it for production or debugging). But before we get into that, you also have the option of using Windows Error Reporting and crash dumps to catch those nasty production crashes, and often times its much, MUCH easier to do that than to use extra WINAPI libraries for stack tracing. So I will begin with a short detour on Windows Error Reporting…

Windows Error Reporting

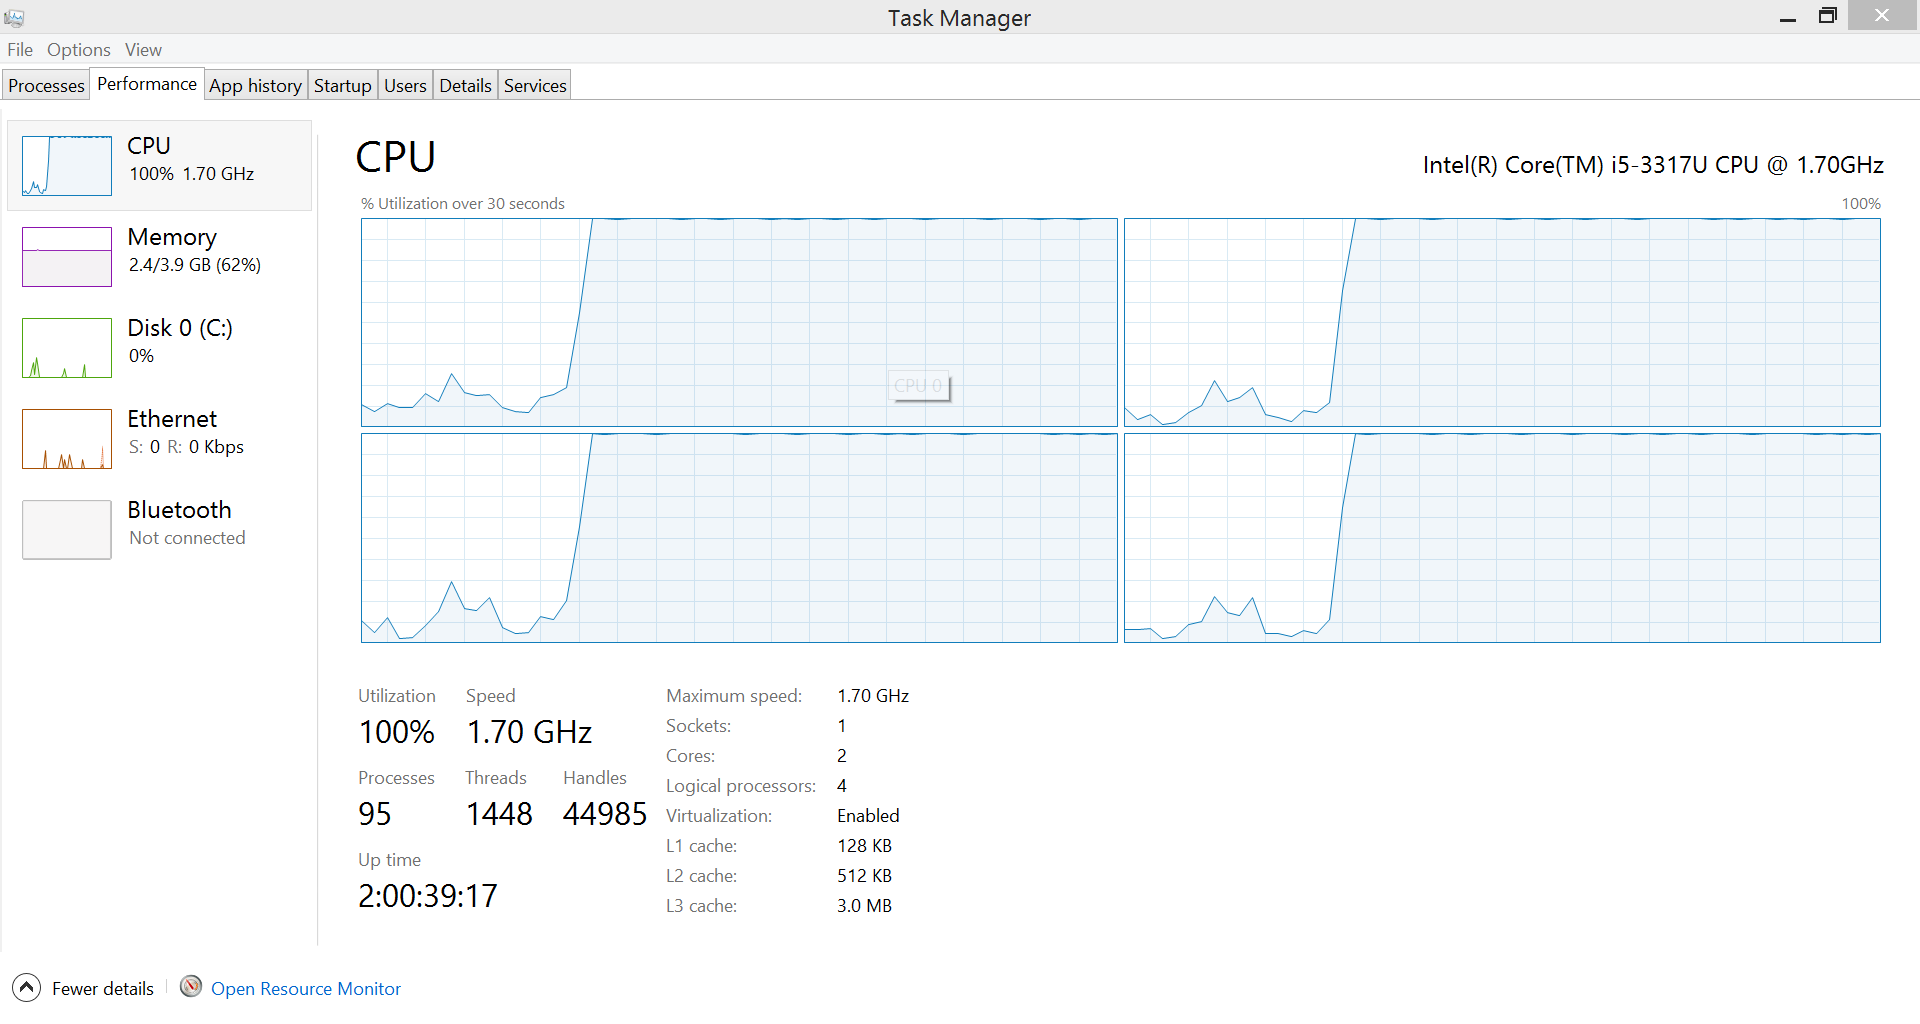
Windows Error Reporting in an integrated OS feature within Microsoft Windows that allows you to generate crash dumps whenever a crash happens on any application running on your system. Generated crash dumps are files that you can open in Visual Studio and use to hook the Visual Studio debugger into. If you’ve never done that, I suggest you try it out right away! The crashed state of your application is essentially snapshot-ed into the dump file, so you’ll see the exact thread that threw the exception and its associated error messages. In fact, you’ll even be able to see where all running threads are at. If you’ve never used the Threads view while debugging, you’re really missing out. Its available in the top menu of Visual Studio while you’re debugging: Debug -> Windows -> Threads. You can even generate crash dumps on the fly for most running processes on your system through Task Manager (CTRL+SHIFT+ESCAPE) -> Right click the process you want a dump of -> Generate dump file. Note: I may be wrong but I think you may need to also deploy your application’s .pdb files in order for WER to generate full-on dumps. However, to actually hook the debugger in from your dump, the version of your solution’s code needs to match the version of your binaries that generated the dump.

Tracing a Windows MSVC++ Project’s Stack C#-Style

So if you’re like me and you just got into C++ applications in Windows (MFC, MSVC++, Win32 Console, WINAPI stuff, etc) from a C# background, you’d be pretty upset to find out that tracing just got a whole lot worse. If you’re also like me and want a nice and minimalistic library to use in order to trace your code, please feel free to use my StackTracer.h and StackTracer.cpp files. You can modify these as you wish but the only thing I do ask is that you keep the comment in my StackTracer.h header with my name in it. Also, and as always, you must agree to assume all liability and responsibility when using any code I provide. The StackTracing header and implementation basically just use the dbghelp.lib library (part of the WINAPI) to call functions like CaptureStackBackTrace or StackWalk, which basically allow you to walk the stack. The stack is, well, as you’ve come to know from C#, a place where stack frames reside, frames which store all kinds of neat information like return addresses and other things which we use to walk backwards up the call stack in order to see what went wrong.

How to Properly Set Up StackTracer

  • Recommended: Download the latest Standalone Debugging Tools for Windows (WinDbg) from MSDN. Install it. Find where it installed dbghelp.lib on your system as well as the dbghelp.dll file. Copy dbghelp.lib into a directory your project includes for libraries, and copy dbghelp.dll into the location where you run your project from (like the bin directory or something).
  • You must include dbghelp.lib into your project’s Linker’s dependencies in order to make use of these APIs in your project (Project Properties -> Configuration Properties -> Linker -> Input -> Additional Dependencies and add dbghelp.lib).
  • In order for everything to work with stack tracing, the PDB files must be present. Please ensure that your project is set to output debug information and has its PDBs in the working directory. You may set this by right-clicking your project, navigating to Properties -> Configuration Properties -> Linker -> Debugging, and set Generate Debug Info to Yes (/DEBUG), also making sure to set GenerateProgramDatabaseFile right below it to your output directory (typically, this is $(OutDir)$(TargetName).pdb).
  • Once enabled, you might see partial stack traces. This is because the inline optimization is enabled, or because your method is explicitly marked as inline. You can disable this feature on your project, by right-clicking it and navigating to Properties -> Configuration Properties -> C++ -> Optimization -> Inline Function Expansion and setting it to Disabled (/Ob0). For inline methods, you should search your project for the inline keyword and remove these methods temporarily.
  • Also, if you ever need to print a complete stack trace from somewhere in your code, you may use the PrintStackTrace() method. This will help if you have multiple threads contending for the same method, and are trying to figure out why something of that nature isn’t working. Inline methods and the inline optimizations may also cause you to see partial stack traces with this method as well, so it is recommended that you disable it while testing.
  • Yes, it catches C++ exceptions as well as SEH exceptions and I’m willing to bet that it also catches MFC exceptions. I’ve seen it work magic on runtime and believe me, it caught everything I pitched it so far and I didn’t even start playing baseball with it.
  • Yes, as you can tell from my overloads, it supports Win32, x64, x86, Unicode, Multibyte, you name it.
  • If you’ve read this far and understood everything thus far, then just include StackTracer.h and StackTracer.cpp in your project and create a new instance of the StackTracer class.

A Note on Inline

So why take a quick detour? Because you should know this. The inline function optimization, in a nutshell: Assume its on in a particular C++ project, and say you have two methods in this project: Method A and Method B. Method A calls Method B. The inline optimization will try to optimize your binaries so that, essentially, the compiled code in Method B is directly copied into Method A. If this happens, when the stack trace is printed, you will only see a partial stack trace, so your trace will likely start from Method A, because it never loaded a stack frame for the call to Method B (oh yes, these are the intricacies of methods in Windows). You may wonder why you always get a complete stack trace in C# applications? Well, actually there wasn’t any support for inline methods in C# as far as I know until .NET 4.5…that’s REALLY fresh considering when I wrote this article, and I’m not sure how it handles exceptions thrown within an inline C# method…something for you to try.

StackTracer.h

#pragma once

/*
StackTracer - v1.0 by Alexandru Dima

By default, StackTracer enables WER (Windows Error Reporting) to create crash dumps. This can be toggled by setting ENABLE_WER_CRASH_DUMPS to TRUE or FALSE. What it does is it creates a registry
key that tells Windows Error Reporting to generate crash dumps whenever an application crashes. The location of the dumps depend on what account you run the application with. They can can be dumped
out at C:\Windows\System32\TRACE_DUMP_FOLDER_LOCATION for example if running under the LOCAL SYSTEM account in Windows, or the respective user account folder for your current user account, just as an
example. WER will then try dumping all application crashes on the current machine there, not just for the application you run this code on. These dumps (.dmp files) located at TRACE_DUMP_FOLDER_LOCATION
can be opened in Visual Studio and used, against matching code (meaning your binaries have to match your code), to debug into the crash location. Therefore, it is recommended that you perfectly
save the code used in a particular deployment.

You can set EXCEPTION_STACK_TRACING_ENABLED to TRUE if you wish to capture stack traces on unhandled exceptions, as they will go to the vectored exception handler and print out the stack for that
exception. By default this feature is enabled (TRUE). Once enabled, you might see partial stack traces. This is because the inline optimization is enabled, or because your method is explicitly marked
as inline. You can disable this feature on your project, by right-clicking it and navigating to Properties -> Configuration Properties -> C++ -> Optimization -> Inline Function Expansion and
setting it to Disabled (/Ob0). For inline methods, you should search your project for the inline keyword and remove these methods temporarily.

Also, if you ever need to print a complete stack trace from somewhere in your code, you may use the PrintStackTrace() method. This will help if you have multiple threads contending for the
same method, and are trying to figure out why something of that nature isn't working. Inline methods and the inline optimizations may also cause you to see partial stack traces with this
method as well, so it is recommended that you disable it while testing.

And as always, in order for everything to work with stack tracing, the PDB files must be present. Please ensure that your project is set to output debug information and has its PDBs in the
working directory. You may set this by right-clicking your project, navigating to Properties -> Configuration Properties -> Linker -> Debugging, and set Generate Debug Info to Yes (/DEBUG),
also making sure to set GenerateProgramDatabaseFile right below it to your output directory (typically, this is $(OutDir)$(TargetName).pdb).

Once enabled, StackTracer's methods output to the standard output. Note, you must include dbghelp.lib in the Linker's dependencies in order to make use of these API's in another project.
*/

#include <Windows.h>
#include <dbghelp.h>
#include <sstream>
#include <iostream>

// Enables or disables stack tracing.
#define ENABLE_WER_CRASH_DUMPS TRUE
// Enables or disables stack tracing.
#define EXCEPTION_STACK_TRACING_ENABLED TRUE
// Sets the maximum function name of all functions when doing stack tracing.
#define TRACE_MAX_FUNCTION_NAME_LENGTH 1024
// Sets the maximum number of stack frames to walk when calling PrintStackTrace().
#define TRACE_MAX_STACK_FRAMES 1024
// Determines wether or not to catch exceptions as part of the WINAPI stack tracing methods.
#define TRACE_LOG_ERRORS FALSE
// This setting tells Windows Error Reporting to dump crashes to C:\Windows\System32\TRACE_DUMP_FOLDER_LOCATION under Local System credentials (services)...once set, it tries to dump ALL application crashes.
#define TRACE_DUMP_FOLDER_LOCATION "CrashDumps"
// Sets the maximum number of dump files for your TRACE_DUMP_FOLDER_LOCATION. Once max'd out, it will roll over.
#define TRACE_DUMP_MAXIMUM_DUMP_FILES 100
// Sets the dump type to a mini-dump. Possible values are: 0 (Custom Dump), 1 (Mini Dump), or 2 (Full Dump).
#define TRACE_DUMP_TYPE 1

void PrintStackTrace();

class StackTracer
{
public:
	StackTracer();
	~StackTracer();
};

StackTracer.cpp

#include "stdafx.h"
#include "StackTracer.h"

using namespace std;

#ifdef UNICODE
#define tstringstream wstringstream
#define tstring wstring
#define tcout wcout
#else
#define tstringstream stringstream
#define tstring string
#define tcout cout
#endif

// This function may be called at any point in time to get a print-out of the stack trace.
void PrintStackTrace()
{
	tstringstream stream;
	stream << _T("Started a stack trace") << std::endl;
	void *stack[TRACE_MAX_STACK_FRAMES];
	HANDLE process = GetCurrentProcess();
	SymInitialize(process, NULL, TRUE);
	WORD numberOfFrames = CaptureStackBackTrace(0, TRACE_MAX_STACK_FRAMES, stack, NULL);
	SYMBOL_INFO *symbol = (SYMBOL_INFO *)malloc(sizeof(SYMBOL_INFO) + (TRACE_MAX_FUNCTION_NAME_LENGTH - 1) * sizeof(TCHAR));
	memset(symbol, 0, sizeof(SYMBOL_INFO) + (TRACE_MAX_FUNCTION_NAME_LENGTH - 1) * sizeof(TCHAR));
	symbol->MaxNameLen = TRACE_MAX_FUNCTION_NAME_LENGTH;
	symbol->SizeOfStruct = sizeof(SYMBOL_INFO);
	DWORD displacement;
	IMAGEHLP_LINE64 *line = (IMAGEHLP_LINE64 *)malloc(sizeof(IMAGEHLP_LINE64));
	memset(line, 0, sizeof(IMAGEHLP_LINE64));
	line->SizeOfStruct = sizeof(IMAGEHLP_LINE64);
	for (int i = 0; i < numberOfFrames; i++)
	{
		DWORD64 address = (DWORD64)(stack[i]);
		if (SymFromAddr(process, address, NULL, symbol))
		{
			if (SymGetLineFromAddr64(process, address, &displacement, line))
			{
				stream << _T("\tat ") << symbol->Name << _T(" in ") << line->FileName << _T(": line: ") << std::dec << line->LineNumber << _T(": address: ") << std::hex << symbol->Address << std::endl;
			}
			else
			{
				if (TRACE_LOG_ERRORS)
				{
					stream << _T("Error from SymGetLineFromAddr64: ") << std::hex << GetLastError() << std::endl;
				}
				stream << _T("\tat ") << symbol->Name << _T(": address: ") << std::hex << symbol->Address << std::endl;
			}
		}
		else if (TRACE_LOG_ERRORS)
		{
			stream << _T("Error from SymFromAddr: ") << std::hex << GetLastError() << std::endl;
		}
	}
	tstring str = stream.str();
	LPCTSTR message = str.c_str();
	std::tcout << message;
	free(symbol);
	free(line);
}

void PrintStackTraceFromExceptionContext(CONTEXT context, DWORD exceptionCode)
{
	tstringstream stream;
	if (exceptionCode)
	{
		stream << _T("Caught exception ") << std::hex << exceptionCode << std::endl;
	}
	else
	{
		stream << _T("Caught an exception") << std::endl;
	}
	HANDLE thread = GetCurrentThread();
	HANDLE process = GetCurrentProcess();
	// The image and frame will be set based on the processor architecture. I don't set these addresses at random or through some voodoo; they come from the documentation at http://msdn.microsoft.com/en-us/library/windows/desktop/ms680646(v=vs.85).aspx.
	DWORD image;
#ifdef _M_IX86
	STACKFRAME *frame = (STACKFRAME *)malloc(sizeof(STACKFRAME));
	memset(frame, 0, sizeof(STACKFRAME));
	image = IMAGE_FILE_MACHINE_I386;
	frame->AddrPC.Offset = context.Eip;
	frame->AddrPC.Mode = AddrModeFlat;
	frame->AddrFrame.Offset = context.Ebp;
	frame->AddrFrame.Mode = AddrModeFlat;
	frame->AddrStack.Offset = context.Esp;
	frame->AddrStack.Mode = AddrModeFlat;
#elif _M_X64
	STACKFRAME64 *frame = (STACKFRAME64 *)malloc(sizeof(STACKFRAME64));
	memset(frame, 0, sizeof(STACKFRAME64));
	image = IMAGE_FILE_MACHINE_AMD64;
	frame->AddrPC.Offset = context.Rip;
	frame->AddrPC.Mode = AddrModeFlat;
	frame->AddrFrame.Offset = context.Rbp;
	frame->AddrFrame.Mode = AddrModeFlat;
	frame->AddrStack.Offset = context.Rsp;
	frame->AddrStack.Mode = AddrModeFlat;
#elif _M_IA64
	STACKFRAME64 *frame = (STACKFRAME64 *)malloc(sizeof(STACKFRAME64));
	memset(frame, 0, sizeof(STACKFRAME64));
	image = IMAGE_FILE_MACHINE_IA64;
	frame->AddrPC.Offset = context.StIIP;
	frame->AddrPC.Mode = AddrModeFlat;
	frame->AddrFrame.Offset = context.IntSp;
	frame->AddrFrame.Mode = AddrModeFlat;
	frame->AddrBStore.Offset = context.RsBSP;
	frame->AddrBStore.Mode = AddrModeFlat;
	frame->AddrStack.Offset = context.IntSp;
	frame->AddrStack.Mode = AddrModeFlat;
#else
#error "This platform is not supported."
#endif
	SYMBOL_INFO *symbol = (SYMBOL_INFO *)malloc(sizeof(SYMBOL_INFO) + (TRACE_MAX_FUNCTION_NAME_LENGTH - 1) * sizeof(TCHAR));
	memset(symbol, 0, sizeof(SYMBOL_INFO) + (TRACE_MAX_FUNCTION_NAME_LENGTH - 1) * sizeof(TCHAR));
	symbol->MaxNameLen = TRACE_MAX_FUNCTION_NAME_LENGTH;
	symbol->SizeOfStruct = sizeof(SYMBOL_INFO);
	IMAGEHLP_LINE64 *line = (IMAGEHLP_LINE64 *)malloc(sizeof(IMAGEHLP_LINE64));
	memset(line, 0, sizeof(IMAGEHLP_LINE64));
	line->SizeOfStruct = sizeof(IMAGEHLP_LINE64);
	DWORD displacement = 0;
	while (StackWalk(image, process, thread, frame, &context, NULL, NULL, NULL, NULL) && frame->AddrPC.Offset != frame->AddrReturn.Offset && frame->AddrPC.Offset != 0)
	{
		if (SymFromAddr(process, frame->AddrPC.Offset, NULL, symbol))
		{
			if (SymGetLineFromAddr64(process, frame->AddrPC.Offset, &displacement, line))
			{
				stream << _T("\tat ") << symbol->Name << _T(" in ") << line->FileName << _T(": line: ") << std::dec << line->LineNumber << _T(": address: ") << std::hex << symbol->Address << std::endl;
			}
			else
			{
				if (TRACE_LOG_ERRORS)
				{
					stream << _T("Error from SymGetLineFromAddr64: ") << std::hex << GetLastError() << std::endl;
				}
				stream << _T("\tat ") << symbol->Name << _T(": address: ") << std::hex << symbol->Address << std::endl;
			}
		}
		else if (TRACE_LOG_ERRORS)
		{
			stream << _T("Error from SymFromAddr: ") << std::hex << GetLastError() << std::endl;
		}
	}
	DWORD error = GetLastError();
	if (error && TRACE_LOG_ERRORS)
	{
		stream << _T("Error from StackWalk64: ") << std::hex << error << std::endl;
	}
	tstring str = stream.str();
	LPCTSTR message = str.c_str();
	std::tcout << message;
	free(symbol);
	free(line);
	free(frame);
}

// This method is called on the tracer's constructor and tells Windows Error Reporting not only where to put crash dumps, but to actually generate them.
void SetRegistryKeyForWindowsErrorReportingToGenerateMiniCrashDumpsOnACrash()
{
	HKEY key;
	if (RegCreateKeyEx(HKEY_LOCAL_MACHINE, TEXT("SOFTWARE\\Microsoft\\Windows\\Windows Error Reporting\\LocalDumps"), 0, NULL, REG_OPTION_NON_VOLATILE, KEY_ALL_ACCESS, NULL, &key, NULL) == ERROR_SUCCESS)
	{
		DWORD dumpCount = TRACE_DUMP_MAXIMUM_DUMP_FILES;
		RegSetValueEx(key, TEXT("DumpCount"), 0, REG_DWORD, (const BYTE *)(&dumpCount), sizeof(dumpCount));
		DWORD dumpType = TRACE_DUMP_TYPE;
		RegSetValueEx(key, TEXT("DumpType"), 0, REG_DWORD, (const BYTE *)(&dumpType), sizeof(dumpType));
		RegSetValueEx(key, TEXT("DumpFolder"), 0, REG_EXPAND_SZ, (const BYTE *)TEXT(TRACE_DUMP_FOLDER_LOCATION), sizeof(TEXT(TRACE_DUMP_FOLDER_LOCATION)));
		RegCloseKey(key);
	}
}

LONG WINAPI VectoredExceptionCallback(PEXCEPTION_POINTERS exception)
{
	if (exception != nullptr)
	{
		if (exception->ExceptionRecord->ExceptionCode && exception->ExceptionRecord->ExceptionCode <= 2147483647)
		{
			// This is a COM success code and can be ignored according to http://msdn.microsoft.com/en-us/library/windows/desktop/ff485841(v=vs.85).aspx. Anything above that, and you'll want to log it out as an actual exception.
			tstringstream stream;
			stream << _T("Caught COM success code ") << std::hex << exception->ExceptionRecord->ExceptionCode << _T(". Ignoring it.") << std::endl;
			tstring str = stream.str();
			LPCTSTR message = str.c_str();
			std::tcout << message;
		}
		else
		{
			// Trace the stack from the exception (note, this may be a partial stack trace in scenarios where inline compiler optimizations are enabled).
			PrintStackTraceFromExceptionContext(*(exception->ContextRecord), exception->ExceptionRecord->ExceptionCode);
		}
	}
	// Send the exception back to the current process.
	return EXCEPTION_CONTINUE_SEARCH;
}

// This constructor should be called at the start of your main class constructor, and you should only ever create one instance of this per application.
StackTracer::StackTracer()
{
	if (ENABLE_WER_CRASH_DUMPS)
	{
		SetRegistryKeyForWindowsErrorReportingToGenerateMiniCrashDumpsOnACrash();
	}
	if (EXCEPTION_STACK_TRACING_ENABLED)
	{
		SymSetOptions(SYMOPT_DEFERRED_LOADS);
		SymInitialize(GetCurrentProcess(), NULL, TRUE);
		AddVectoredExceptionHandler(NULL, VectoredExceptionCallback);
	}
}

StackTracer::~StackTracer()
{
	if (EXCEPTION_STACK_TRACING_ENABLED)
	{
		SymCleanup(GetCurrentProcess());
	}
}

Example Win32 Console Application that Utilizes a StackTracer Instance

#include "stdafx.h"
#include "StackTracer.h"
#include <process.h>
#include <iostream>

using namespace std;

#ifdef UNICODE
#define tcout wcout
#else
#define tcout cout
#endif

void thirdMethod()
{
	std::tcout << "thirdMethod was called." << std::endl;
	throw new exception();
}

void secondMethod()
{
	std::tcout << "secondMethod was called." << std::endl;
	thirdMethod();
}

void firstMethod(void *parameters)
{
	std::tcout << "firstMethod was called." << std::endl;
	secondMethod();
	_endthread();
}

int _tmain(int argc, _TCHAR* argv[])
{
	std::tcout << "About to start the StackTracer test harness." << std::endl;
	StackTracer *tracer = new StackTracer();
	_beginthread(firstMethod, 0, NULL);
	std::tcout << "Started the StackTracer test harness successfully." << std::endl;
	std::cin.get();
	return 0;
}

Example Output

About to start the StackTracer test harness.
Started the StackTracer test harness successfully.
firstMethod was called.
secondMethod was called.
thirdMethod was called.
Caught exception e06d7363
        at RaiseException: address: 76921d05
        at _CxxThrowException: address: 10090af0
        at thirdMethod in c:\users\dima\documents\visual studio 2013\projects\st
acktracing\stacktracing\stacktracing.cpp: line: 18: address: 84ca90
        at secondMethod in c:\users\dima\documents\visual studio 2013\projects\s
tacktracing\stacktracing\stacktracing.cpp: line: 24: address: 84ca10
        at firstMethod in c:\users\dima\documents\visual studio 2013\projects\st
acktracing\stacktracing\stacktracing.cpp: line: 30: address: 84c980
        at _beginthread: address: ffd31e0
        at _endthread: address: ffd33e0
        at BaseThreadInitThunk: address: 74959191
        at RtlInitializeExceptionChain: address: 76f2a847
        at RtlInitializeExceptionChain: address: 76f2a847